
Page 61 - Ingeniantes 421 interactivo
P. 61
Revista Ingeniantes 2017 Año 4 No.2 Vol.1
BIBLIOGRAFÍA
[1]. Dennis, E. L., & Thompson, P. M. (2014).
Functional brain connectivity using fMRI in aging
and Alzheimer’s disease. Neuropsychology review,
24(1), 49-62.
[2]. He, Y., & Evans, A. (2010). Graph theoretical
modeling of brain connectivity. Current opinion in
neurology, 23(4), 341-350.
[3]. Boersma, M., Smit, D. J., Boomsma, D. I.,
De Geus, E. J., Delemarre-van de Waal, H. A., &
Stam, C. J. (2013). Growing trees in child brains:
graph theoretical analysis of electroencephalo-
graphy-derived minimum spanning tree in 5-and
7-year-old children reflects brain maturation. Brain
connectivity, 3(1), 50-60.
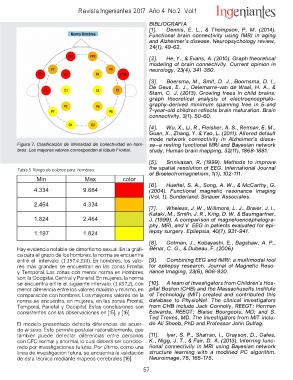
Figura 7. Clasificación de intensidad de conectividad en hom- [4]. Wu, X., Li, R., Fleisher, A. S., Reiman, E. M.,
bres. Los mayores valores corresponden al lóbulo Frontal. Guan, X., Zhang, Y. & Yao, L. (2011). Altered default
mode network connectivity in Alzheimer’s disea-
se—a resting functional MRI and Bayesian network
study. Human brain mapping, 32(11), 1868-1881.
Tabla 5. Rango de colores para hombres. [5]. Srinivasan, R. (1999). Methods to improve
the spatial resolution of EEG. International Journal
Min Max color of Bioelectromagnetism, 1(1), 102-111.
[6]. Huettel, S. A., Song, A. W., & McCarthy, G.
4.334 9.664 (2004). Functional magnetic resonance imaging
(Vol. 1). Sunderland: Sinauer Associates.
2.464 4.334 [7]. Wheless, J. W., Willmore, L. J., Breier, J. I.,
Kataki, M., Smith, J. R., King, D. W. & Baumgartner,
1.824 2.464 J. (1999). A comparison of magnetoencephalogra-
phy, MRI, and V‐EEG in patients evaluated for epi-
1.197 1.824 lepsy surgery. Epilepsia, 40(7), 931-941.
[8]. Gotman, J., Kobayashi, E., Bagshaw, A. P.,
Hay evidencia notable de dimorfismo sexual. En la gráfi- Bénar, C. G., & Dubeau, F. (2006).
ca para el grupo de los hombres, la norma se encuentra [9]. Combining EEG and fMRI: a multimodal tool
entre el intervalo: (1.197,4.334). En hombres, los valo- for epilepsy research. Journal of Magnetic Reso-
res más grandes se encuentran en las zonas Frontal, nance Imaging, 23(6), 906-920.
y Temporal. Las zonas con menor norma en Hombres [10]. A team of investigators from Children’s Hos-
son: la Occipital, Central y Parietal. En mujeres, la norma pital Boston (CHB) and the Massachusetts Institute
se encuentra entre el siguiente intervalo: (1.057,2), con of Technology (MIT) created and contributed this
menor diferencia entre los valores máximo y mínimo, en database to PhysioNet. The clinical investigators
comparación con hombres. Los mayores valores de la from CHB include Jack Connolly, REEGT; Herman
norma se encuentra, en mujeres, en las zonas Frontal, Edwards, REEGT; Blaise Bourgeois, MD; and S.
Temporal, Parietal y Occipital. Estas conclusiones son Ted Treves, MD. The investigators from MIT inclu-
consistentes con las observaciones en [15], y [16]. de Ali Shoeb, PhD and Professor John Guttag.
El modelo presentado detecta diferencias de acuer- [11]. Iyer, S. P., Shafran, I., Grayson, D., Gates,
do al sexo. Esto permite postular razonablemente, que K., Nigg, J. T., & Fair, D. A. (2013). Inferring func-
también puede detectar diferencias entre personas tional connectivity in MRI using Bayesian network
con CFC normal y anormal, lo cual deberá ser corrobo- structure learning with a modified PC algorithm.
rado por investigaciones futuras. Por último, como una Neuroimage, 75, 165-175.
línea de investigación futura, se encuentra la validación
de esta técnica mediante mapeos cerebrales [16].
57